In today’s data-driven workplace, clear visualization of key performance metrics is essential. Displaying business intelligence on TV screens not only boosts employee engagement but also enables real‐time decision making. Whether you want to keep your sales team motivated, monitor IT systems, or track operations, the right BI dashboard can transform your workplace into a hub of actionable insights. In this guide, we review and compare the eight best BI dashboards for office TV displays, provide setup tips for hassle‑free “bi dashboard displays,” and show you how RocketScreens can simplify the process of turning any screen into a powerful “business intelligence screen.”
Why Display BI Dashboards on Workplace TV Screens?
Enhance Team Collaboration and Transparency
When dashboards are visible in common areas, everyone—from frontline workers to executives—can see how the company is performing. This constant stream of information builds a culture of accountability, aligns teams around common goals, and encourages data‑driven decisions.
Real-Time Data for Rapid Response
Modern dashboards update automatically and in real time, ensuring that any sudden shifts in performance are immediately visible. This rapid feedback loop allows teams to quickly adjust strategies, resolve issues, and celebrate successes as they happen.
Motivation and Engagement
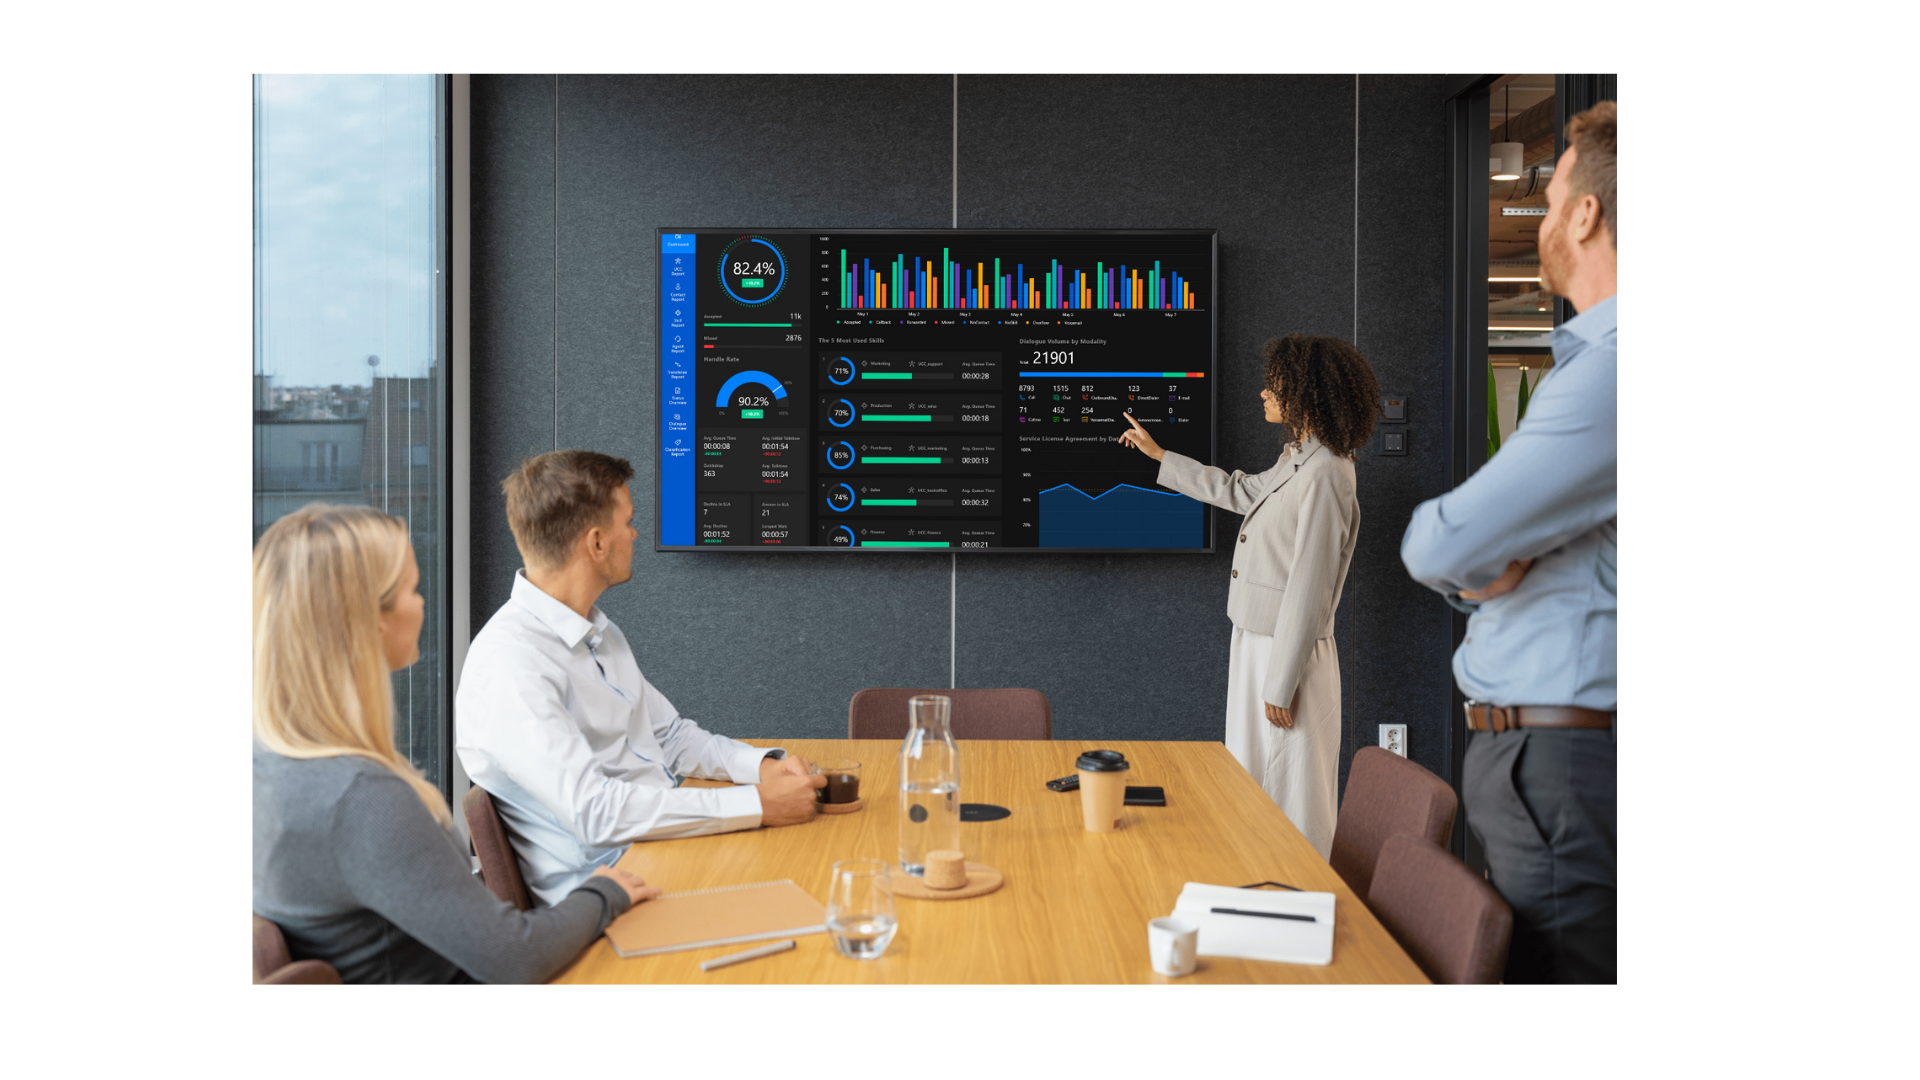
Large, well‑designed visualizations displayed on TV screens captivate attention. Whether it’s a sales leaderboard, project progress tracker, or IT monitoring dashboard, displaying key metrics publicly can motivate teams and create healthy internal competition.
Simplify Data Communication
Instead of complex spreadsheets or reports locked behind login walls, business intelligence screens allow for simplified, at‑a‑glance communication. With the right setup, “bi dashboard displays” provide clear, accessible information that everyone can understand—even if they aren’t data experts.
The 8 Best BI Dashboards for Office TV Displays
1. Microsoft Power BI
Overview:
Microsoft Power BI is one of the most popular business intelligence tools available today. Known for its robust data integration capabilities, Power BI allows users to transform raw data into interactive dashboards, charts, and reports. It is widely used across industries and integrates seamlessly with other Microsoft products.
Key Features:
- Interactive Visualizations: Create rich visualizations ranging from simple bar charts to complex maps and scatter plots.
- Real-Time Data: Leverage real‑time data feeds for up-to-date insights.
- Integration: Connect with Excel, SQL Server, Azure, and hundreds of other data sources.
Pricing:
Power BI Pro starts at approximately $10 per user per month. Premium options are available for larger enterprises, providing additional features and dedicated capacity.
Limitations:
For TV displays, you may need additional licensing for embedding dashboards securely. Some advanced features require a learning curve if you are new to BI tools.
Display Tips:
To display Power BI dashboards on workplace TV screens, consider using a digital signage solution like RocketScreens. With its seamless Power BI integration, you can push your dashboards directly to any TV, ensuring that the “bi dashboard displays” are both secure and refresh automatically.
2. Tableau
Overview:
Tableau is renowned for its powerful data visualization capabilities. Its drag-and‑drop interface makes it easy for users to build interactive dashboards that can communicate complex data in a visually appealing way.
Key Features:
- Advanced Analytics: Build interactive, real‑time dashboards with extensive customization options.
- Scalability: Suitable for both small businesses and large enterprises.
- User-Friendly: Intuitive design enables non‑technical users to create compelling visualizations.
Pricing:
Tableau Creator is priced around $70 per user per month. Viewer and Explorer licenses are available for sharing and collaborating on dashboards.
Limitations:
While Tableau dashboards look great, embedding them securely for public display might require additional setup. Cost can be higher compared to some alternatives for smaller teams.
Display Tips:
Tableau dashboards can be rotated on large screens using digital signage software. Integrating with platforms like RocketScreens allows you to display multiple dashboards in a looping playlist, making your “business intelligence screens” dynamic and engaging.
3. Looker
Overview:
Now part of Google Cloud, Looker is designed to turn complex data into actionable insights. It focuses on providing an integrated view of your data and supports both ad‑hoc analysis and robust reporting.
Key Features:
- Data Modeling: Use LookML to create reusable data models.
- Embedded Analytics: Easily embed dashboards into other applications or intranets.
- Customization: Fully customizable dashboards that adapt to your business needs.
Pricing:
Looker pricing is typically customized based on your organization’s requirements, often making it more suitable for medium-to-large enterprises.
Limitations:
The complexity of LookML might present a challenge for non‑technical users. Implementation may require professional services, increasing initial costs.
Display Tips:
When deploying Looker dashboards on office TV screens, the native embedding features can be integrated with digital signage platforms. RocketScreens’ ability to securely display embedded dashboards makes it an ideal partner for your “bi dashboard displays.”
4. Salesforce
Overview:
Salesforce’s reporting and analytics tools, such as Einstein Analytics (now Tableau CRM), offer powerful insights directly within the Salesforce ecosystem. These tools help sales teams monitor performance and track critical KPIs.
Key Features:
- Unified Data: Integrates customer data with other business metrics.
- Custom Reports: Build tailored dashboards that reflect your unique sales processes.
- Real-Time Insights: Provides up-to-date data to drive quick decision-making.
Pricing:
Salesforce dashboards are available as part of the broader Salesforce suite. Pricing varies based on the edition and number of users, typically starting around $25 per user per month for basic plans.
Limitations:
The user interface can be less flexible than some dedicated BI tools. Customizing dashboards beyond the standard templates may require additional expertise.
Display Tips:
For a secure and professional display of Salesforce dashboards on TV screens, consider using a digital signage platform like RocketScreens. This allows you to convert Salesforce reports into visually appealing “business intelligence screens” that are easy to update and manage.
5. Zendesk Explore
Overview:
Zendesk Explore is designed to help service and support teams track customer satisfaction and operational metrics. It turns support data into clear, actionable insights.
Key Features:
- Pre-Built Dashboards: Offers ready-made reports for customer service metrics.
- Custom Analysis: Allows you to build custom reports based on your unique support workflows.
- Integration: Seamlessly integrates with the rest of the Zendesk suite.
Pricing:
Zendesk Explore pricing typically starts at around $19 per user per month, with different tiers available depending on the level of functionality required.
Limitations:
Zendesk dashboards are best suited for customer service metrics and might not cover all aspects of business intelligence. Advanced customizations may be limited compared to more comprehensive BI tools.
Display Tips:
When displayed on workplace TV screens, Zendesk dashboards keep your support teams updated on real-time performance metrics. Using RocketScreens to integrate and schedule these dashboards can help prevent manual interventions and ensure continuous updates.
6. Splunk
Overview:
Splunk is a powerful tool for monitoring and analyzing machine data. It’s particularly popular among IT and security teams for its ability to track system performance and detect anomalies.
Key Features:
- Log Analysis: Ideal for monitoring IT infrastructure and security events.
- Custom Dashboards: Create detailed visualizations that track system health and operational metrics.
- Real-Time Processing: Offers real-time monitoring and alerting capabilities.
Pricing:
Splunk offers a free tier with limited data ingestion, while enterprise-level solutions are priced based on data volume, which can become expensive for larger deployments.
Limitations:
The complexity of Splunk can be daunting for users who only require basic BI functionality. Costs may be prohibitive for small to medium-sized enterprises looking solely for dashboard displays.
Display Tips:
For IT teams needing “bi dashboard displays” of operational data, Splunk dashboards can be effectively shown on large screens. Integrating Splunk with RocketScreens can automate report refreshing and ensure that even technical dashboards appear crisp and clear on workplace TV screens.
7. Grafana
Overview:
Grafana is an open-source platform designed primarily for monitoring and observability. It excels at creating real-time dashboards from time-series data, making it popular among DevOps teams.
Key Features:
- Flexible Data Sources: Connects to various databases like Prometheus, InfluxDB, and more.
- Customizable Visualizations: Offers a wide array of plugins and customization options for detailed dashboards.
- Community Support: Being open-source, it benefits from a vibrant community and extensive documentation.
Pricing:
Grafana offers a free tier that is feature-rich, along with enterprise options for additional support and features.
Limitations:
Grafana is primarily designed for IT monitoring and may require additional customization for business analytics. The learning curve can be steep for users not familiar with technical dashboards.
Display Tips:
Grafana dashboards work exceptionally well when displayed on large “business intelligence screens.” By using a digital signage solution like RocketScreens, you can set up Grafana dashboards to cycle through multiple reports automatically, keeping your team informed of key system metrics at all times.
8. Klipfolio
Overview:
Klipfolio is a cloud-based dashboard platform designed to bring business data together in one central place. It’s well‑suited for marketing, sales, and operational analytics.
Key Features:
- Real-Time Dashboards: Build dynamic dashboards that update automatically with live data.
- Customizable Widgets: Offers a variety of pre-built widgets that can be easily configured.
- Ease of Use: Intuitive design means you can create dashboards quickly without extensive technical knowledge.
Pricing:
Klipfolio offers various pricing plans starting from a free tier with limited functionality, up to higher-tier plans for more advanced features and data integrations.
Limitations:
The free plan may be too restrictive for larger organizations with diverse data needs. As with many cloud solutions, there might be performance concerns if you are displaying highly complex dashboards on TV screens.
Display Tips:
For marketing and sales teams, Klipfolio dashboards can be transformed into engaging “bi dashboard displays.” With RocketScreens integration, you can schedule Klipfolio dashboards to display during key business hours, ensuring that your business intelligence screens are always up to date and visually compelling.
Comparing the Top BI Dashboards
When selecting the best BI dashboard for display on workplace TV screens, consider the following factors:
- Ease of Integration: Power BI and Tableau are widely recognized for their extensive integrations. They work seamlessly with many digital signage solutions, including RocketScreens. Looker and Salesforce often require more complex setups but offer deep integration with cloud data sources. Grafana and Klipfolio are particularly appealing for their open APIs and flexibility in connecting to various data sources.
- Pricing and Licensing: For smaller teams or cost‑sensitive environments, Grafana’s free tier or Klipfolio’s lower‑tier plans might be sufficient. Enterprises with large data volumes may prefer Power BI Premium or Tableau’s enterprise solutions, even though they come at a higher cost. Salesforce and Zendesk dashboards typically come as part of broader service suites, which might affect your total licensing costs.
- Display and Interactivity: For effective “business intelligence screens” in public areas, the dashboard should have a clean interface without clutter or unnecessary controls. Tools like Power BI and Tableau offer highly interactive displays, but when it comes to TV screens, you may prefer a more static, continuously updated view. Platforms with built‑in support for digital signage (or easy integration with digital signage software like RocketScreens) provide the best experience in terms of auto‑refresh and scheduling.
- Customization and User Experience: Looker and Tableau shine in customization, allowing you to tailor dashboards to specific audiences. Klipfolio offers a balance between ease of use and customization, making it ideal for rapid deployment in office environments. Zendesk Explore is tailored for customer service metrics, ensuring that the right data is always in front of your support teams.
How to Set Up Your BI Dashboard on a Workplace TV Screen
No matter which BI tool you choose, the ultimate goal is to turn your data into an engaging display for your team. Here’s a step‑by‑step setup guide using a digital signage solution like RocketScreens:
Step 1: Choose Your BI Dashboard
- Select the Report: Decide which report or dashboard best represents the data your team needs to see.
- Optimize the Layout: Ensure that the visualization is clean, with large fonts and clear charts that are readable from a distance.
Step 2: Integrate with Digital Signage Software
- Connect Your BI Tool: Use RocketScreens’ integration options to securely connect to your BI tool. For example, if you’re using Power BI, follow the secure OAuth process to link your account.
- Configure the Display Settings: Set the refresh interval so that your “bi dashboard displays” update automatically. Adjust the layout settings (e.g., full‑screen mode) to remove distractions like browser toolbars or notifications.
Step 3: Deploy to Your TV Screens
- Add Your Screen: Register your TV or digital signage device in the RocketScreens CMS.
- Assign a Channel: Create a dedicated channel for your BI dashboard. This channel can be scheduled to run during business hours.
- Test the Display: Preview the setup to ensure that the dashboard is clear and the data is updating as expected.
- Rotate Multiple Dashboards: If you have several reports, use the playlist feature to rotate through multiple dashboards on one screen.
Step 4: Maintain and Monitor
- Remote Management: With RocketScreens, you can manage your displays remotely. Update settings, change the display schedule, or switch dashboards without needing to access each device physically.
- Monitor Performance: Use the built‑in analytics to track which dashboards are viewed the most and adjust your content strategy accordingly.
Why Choose RocketScreens for Your Business Intelligence Screens?
RocketScreens stands out as a digital signage platform designed with modern workplaces in mind. Here’s why RocketScreens is your best partner for “bi dashboard displays”:
- Seamless Integration with Over 100 Apps: RocketScreens connects with more than 100 cloud applications, including all the major BI tools like Power BI, Tableau, and Looker. This means you can easily pull data from your existing systems and display it on any TV screen in your office.
- Simple and Secure Setup: With RocketScreens, the integration process is streamlined through secure authentication methods (such as OAuth for Power BI). This ensures that your sensitive data remains protected while still being displayed in real time.
- Versatile Player Options: RocketScreens supports multiple player types—from virtual players to physical digital signage devices—so you can choose the best hardware solution for your office environment. Whether you have smart TVs or dedicated digital signage devices, RocketScreens adapts to your needs.
- Easy Content Scheduling and Management: The RocketScreens CMS allows you to create channels, manage playlists, and schedule content with a user-friendly interface. This is ideal for businesses that need to display multiple dashboards throughout the day without manual intervention.
- Cost-Effective Digital Signage: By eliminating the need for dedicated PCs or constant manual updates, RocketScreens reduces the overhead costs associated with traditional digital signage setups. Its cloud-based platform means you can scale your solution as your business grows.
Final Thoughts
Choosing the right BI dashboard for workplace TV screens depends on your unique business needs. Whether you opt for the robust capabilities of Microsoft Power BI, the stunning visualizations of Tableau, or the specialized insights of Zendesk Explore, the goal is to turn raw data into clear, actionable insights visible to everyone.
The eight platforms we’ve reviewed—Power BI, Tableau, Looker, Salesforce, Zendesk Explore, Splunk, Grafana, and Klipfolio—offer a range of features and pricing options. By comparing their integration capabilities, customization options, and display quality, you can select the dashboard that best meets your company’s requirements.
Moreover, a digital signage solution like RocketScreens can make the process of displaying these dashboards effortless. With seamless integration, automatic refreshing, and centralized management, RocketScreens transforms any screen into a dynamic “business intelligence screen” that keeps your team informed, engaged, and ready to act on real‑time data.


